Is the Market too Expensive?

Turn on CNBC and you’ll be bombarded by dooms-day prognosticators.     “Feds around the world has gone nuts …. too much cheap money …..  market is crazy…  market is on steroid …  watch out !   bubble will burst….”    Really ?

I decided to dig deeper.    I think I’ll just keep it really simple :

To say the market has gone too high and it’s a bubble, I take it to mean that stock prices are now at a level that is unsupported by earnings, aka unreasonably high P/E.    But what P/E ratio is considered too high?

I downloaded the data from Standard and Poor’s website.  Here’s what I got :

S&P PE Ratio

There are some years during the 2001 and 2008 market crash when the P/E ratio was completely out of whack.   I excluded those and took the average.  It came out to be about 18.

Currently S&P500 P/E ratio is 17.4, based on reported earnings as of Sept 2013.   Compared to historical data,  17.4 is average.   Definitely can’t be considered a bubble.

Another way to look at whether P/E is too high is really to reverse it and look at E/P.  That’s the earning’s yield.   The current earning yield is 5.75%.   Compared to the 10 year treasury yield of 2.65%,  the yield spread is 310 basis points.   Again, the yield spread is higher than long term average.    Therefore the stock market cannot be called a bubble at the current price with any stretch of the imagination.   I would consider it fairly price.

I look further into the P/Es of other markets.   I found that the P/Es of Europe and Asia are even more lucrative.

Major Markets Index

Yes, I agree –  we must not just simple invest in a market because the P/E ratio is low.   Granted.  However,  current facts gave me strong confidence to stay in equity despite the fact that majority of the world equity markets have appreciated substantially in the last 3 years.    I will probably shift more money to some Asian markets which I’m familiar with as well as some European markets as well in 2014.

Posted in Learning, Value Investing | Leave a comment

Is Gold Really a Good Hedge for Inflation and for Stocks ?

  • Few years ago,  my “wealth manager” told me that all the pumping of money into the markets by central banks around the world will cause hyper inflation.   Not only will my assets shrink in real value,  my stock-heavy portfolio will be at risks too.  Reason is when hyper inflation hits,  the easy money  party will be over and the  stock markets will crash.
  • As result,  I should have gold in my portfolio.     Reason :  Gold historically has proven to be a good hedge for inflation as well as the stock market.     When all the fiat money devalues,  gold is the holder of true value.     In addition,  when stock markets crashes, investors will flock to gold even more.
  • Well…. Sounded reasonable.   I allocated 10% of my portfolio to gold.    Since then gold price has increased substantially.   Yeah!   Felt like a genius !   But wait a minute !    The dreaded super inflation actually didn’t happen.  Stock didn’t drop but went up significantly instead.     None of the predicted phenomena happened, but why did gold price appreciate?     Although I made money,  I suspected that it was luck much more than a sound strategy.   I decided to test the two hypothesis to see if they are sound.

Here’s the data I looked at :

  • Historical Prices for Gold
  • Source Gold Price – World Gold Council http://www.gold.org/
  • S&P 500 –  I use the average prices of the last 5 trading days in each year instead of the final day.   Reason is to smoothen out the final day volatility.

Hypothesis  # 1 –  Gold is a good inflation hedge

  • The average annual return of gold between 1978 and 2012 was 5.89%.  Slightly above the long-term inflation rate of about 4%.  So –  proof that it’s a good hedge against inflation?   No, not so fast ….  looking at the average alone is deceiving.
  • I realized annual returns of gold  are very lumpy.   It goes through periods of high growth followed by periods of low to negative growth.    As shown in chart below.   1979 was a tremendous year for gold price followed by another 8 years of wild positive and negative swing.   Then another 14 years of mostly negative years.   Then starting from 2002,  gold price resumed 10 years of positive growth.  OK – that’s not so good.   I happened to hit a few years of good positive growth.  But that’s luck.   I could have just as easily hit 10 years of zero to  negative growth.

Gold Price variance by year

  • However, regardless of the lumpiness,  is there proof that gold is correlated to inflation ? Unfortunately, after looking at the data more closely,  the answer is a definitive no.   For gold to be a good hedge, it should show strong positive correlation to inflation,  ie when inflation is high,  gold prices should show strong price gain.   
  • I put the data into Excel.  Result – the correlation coefficient of Gold vs Infation is -0.56.   Not only gold and inflation don’t go hand in hand,  they are actually negatively correlated !    If you eye ball the chart, you can probably see the slight negative tilt.

Gold vs Inflation

Hypothesis # 2 –  Gold is a good stock hedge

  • If gold is not a good hedge against inflation,   is it still a reasonable asset to own because it is a good hedge for stock?
  • The chart below shows the annual variance of S&P 500 index vs Gold prices.    The correlation coefficient is 0.0189.    Oops !   As a good hedge for stocks,  gold and stocks should be negatively correlated.    That means – when stock prices go down, we want gold prices to go up to compensate.
  • In reality,  the correlation between S&P 500 and Gold prices is near zero.  That means there is no correlation at all.

Gold vs S&P 500

Not only is gold not a good hedge for inflation nor stock,  it is not even a good asset to own long term for investment purpose.   First of all,  it’s long term return is pathetic when compared with its high volatility.   Gold has a long term CAGR of 5.9% and a annual return standard deviation  of 26%, compared to 9% and 16% for S&P 500.    Gold has much higher volatility but lower long term compounded return compared to stocks.

Not only that, unlike other commodities,  gold is not even a productive asset.    It has very little industrial use.   Nor does other consumption demand for gold , in terms of jewelry for instance,   justify the price appreciation.

My conclusion is gold’s intrinsic value is based purely on people’s perception, and perception is incredibly dangerous because it can change quickly.    Certainly I do not want to be the one without a chair when the music stops.

The immediate actions I took –  redeployed all my gold investments to stocks and fired my wealth manager.

In the past,  many of my investment decisions were based on things that I learned but not necessarily empirically validated.      Now that I’m managing money full time and with all the free tools and data available online,  the cost of finding out has become so affordable,  I’m going to do the necessary research to either confirm or debunk the beliefs.  I will leave no stone un-turned.    To me, investment has become much more of a science than an art.

Posted in Learning, Uncategorized, Value Investing | Leave a comment

Options Trade for Value Investors

As a value investor,   I normally wait for a stock to sell off to a price that offers sufficient margin of safety before I buy.   However,  very often,  the stock price would get near but not hitting my buy price before rebounding to new heights.

In some cases,  I have waited for a long time for the stock to come so close.   That is why it is extremely frustrating to walk away empty handed.     The temptation is to start giving in to the market and get in at higher prices,   but that is the last thing that a disciplined value investor should do because once I start to compromise on entry prices,  it’ll be a long way down a slippery slope.

Luckily, I found a solution.    I can have the cake and eat it too….  by using options.    The solution is really simple –  sell an out-of-the-money Put while simultaneously buy a out-of-the-money Call.

For example –  AAPL is hovering around $400+ couple days ago.   Assume I am happy to pick up APPL stock at $380 based on my analysis.   Instead of waiting for AAPL to get to $380,  I can sell a 380 Put and Buy a 420 Call and lock in the trade NOW.

Example below :

Inline image 2

As shown above,  the Oct 13, Short 380 Put / Long 420 Call receives a credit of $2.15.  That means,  I’ll receive $215 per lot for establishing this position.   Not bad at all…   not only do I not incur any cash,  I am actually getting paid while I wait !

Yes, I’ll have to incur $11,489 in margin requirement or buying power reduction.   But this is not cash.   It just reduces my ability to buy options by $11.5K.     For me, that’s okay.  I have other long equity position in my account that has generated more than enough “free” option buying power for me to get into this trade.    More importantly, I don’t have to incur any margin interest either for this trade.

In contrast, if I were to purchase 100 shares of AAPL now,  I’d have to incur about $40,000 cash immediately.

The P&L graph shows that by expiration,  if AAPL goes below $380,  I will be assigned 100 shares of AAPL, which I’ll have to pay $380 each.   That’s fine.   $380 is my target buy price anyway.

If, just hypothetically, AAPL announces a fantastic new product that no one was expecting and the stock price jumped to $600,  that’ll be fantastic !    I’ll happily cash out the profit in the call option and let the Put option expire worthless or buy back at a nominal cost.

If,  however, AAPL continues to hover between $380 and $420 till expiration,  that’s fine too.   I will just pocket the $215 credit I received and look to establish another similar trade a few months out again.  I’ll be happy to keep doing this trade until AAPL either falls and let me buy the stock at my desired price or run up and let me take my profit.   Either way, I’ll be happy.    If I have to keep doing this option trade a few more times,  I’ll just continue to earn the couple hundred bucks each time.   The important thing is this trade doesn’t hold up any cash and as a result, there is no real cost to me.    It’s  essentially a free trade that pays me some pocket money while I wait.    What else can I ask for?

Posted in Options Strategies, Options Techniques, Value Investing | Leave a comment

Fooled By Randomness

When I started investing many years ago, I was intrigued by technical analysis.   I was told price charts contain everything there is to know in order to profit from the market because market movements are driven primarily by human emotions.   These market movements tend to repeat themselves because human then to do the same thing under the influence of greed and fear.        Only if I learned how to recognize and interpret the patterns printed on charts, I would know with better than average probability what the market would likely do next.      Markets will change but human emotions won’t.  Therefore, these patterns will repeat over and over again for technical analysts to profit from.

That argument was quite convincing.     So I spent couple years learning from classes, coaches as well as real live trading.    However, after trading technically for a couple years,  I chanced upon a book by Nassim Taleb called Fooled by Randomness.     From the book, I realized the patterns seen on charts are nothing more than figment of our own imaginations.    Our brains are wired to recognize patterns, whether they exist or not, like watching shapes form in the clouds.   So, even though the market prices can be completely random,  we can clearly see patterns in the charts.

To convince myself, I created a very simple Excel spreadsheet to experiment whether a set of randomly generated numbers can indeed create chart patterns that I can recognize as stock chart patterns.     The spreadsheet is attached here – Randomly Generated Trend Chart

The spreadsheet generates a series of random numbers,  just like a series of stock prices, one price per day.   The next day price is simply a randomly generated variance from the previous day.

I graphed the table and Bingo !   The random numbers were able to create charts that are indistinguishable from any typical stock charts.     The chart do not only look like real stock charts but there are many recognizable technical patterns that people trade on.   See some samples below.

You can see double top, triple top, moving average support/resistance,  trend break out etc… and many more patterns that people spend lots of time and money to learn how to trade with.

Inline image 1
Inline image 2
Inline image 3

Now, I’m convinced that markets are completely random in the short-term.  No one can predict market movements.  Period.   Any patterns that we can see on charts are merely   our brains playing trick on us.     Such patterns can be generated by completely random events and have no predictive value what-so-ever.    However, over the long-run, stock prices will reflect the intrinsic value of the underlying business.

Go ahead and download the spreadsheet (Randomly Generated Trend Chart) and play around with the chart to convince yourself that these chart patterns can be generated completely by random numbers.   Hit F9 key to refresh the spreadsheet and get another random chart.   You can also control how volatile the price changes by controlling cell B2 and whether you want a bullish or bearish bias in cell C2.

Inline image 4
Posted in Technical Analysis | Tagged , , | Leave a comment

The Big Short – US Treasury Bond

Both equity and bond market have been falling in the past couple weeks.    The equity and bond markets have rallied significantly for the past 8 months due to the liquidity from QE.   Now, the party is about to end.   What has gone up will have to come back down.

My view is the draw down on equity will be short-lived.   Reason is QE will be pulled back ONLY IF the US economy has improved to a level that it can stand on its own feet.   Unemployment rate will have to drop to 6.5% or below,  consumer confidence has to continue to improve and housing will have to continue to heal before the punch bowl will be taken away.   These will be all good for stocks in the long run.   Therefore, after the short-term hot money has exited the market, the longer-term value investors will fill the gap in the equity market.

But it’ll be a completely different story for bond, especially the US treasury bonds.   Thanks to the Fed, US treasury bond yield have been artificially depressed for a very long time.   After QE,  the bond price will revert to mean and will do it in a dramatic way.     Currently the 30 year US treasury bond yield is about 3.5%.   Historical average is about 6%.   That’s a 250 basis point spread to revert.

30 Year US Treasury Bond Futures Chart

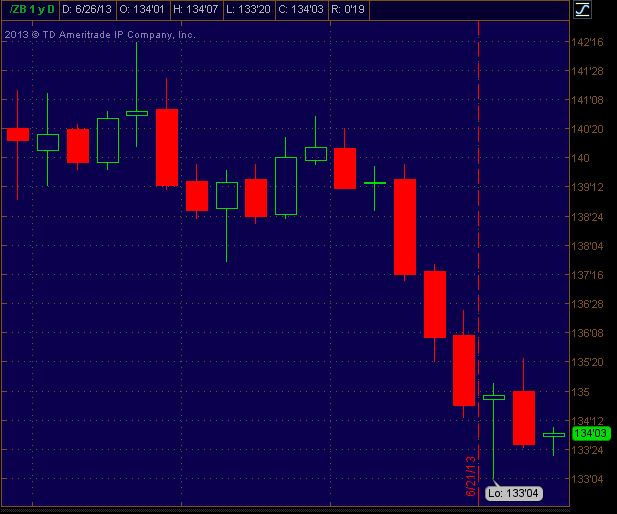
In fact the 30 year treasury bond futures have been collapsing since Benanke’s speech last week.   I believe this is the start of a long bear market for treasury bond and I’m going short it for the long haul.

So how do we as retail investors short bond conveniently, cheaply as well as keep the short position on for a long-period without hassle?    In my view, the easiest way is to buy TBT,  the ProShares UltraShort 20+ Year Treasury ETF.     TBT trades in the opposite direction of the 20+ year US treasury index.    When index falls,  TBT rises twice as much, and like wise, when the index rises,  TBT falls twice as much,  calculated on a daily basis.       For a normal retail investor, TBT is the most convenient trade, as compared to shorting futures or other means.   Trading TBT is just like trading any other stocks or ETF.   It’s convenient, low cost and can be held for the long-term, unlike futures that need to be rolled over during expiration and risks contango or backwardation issues.

However, for the experienced options trader,   there is an even better way – that’s to trade a synthetic long position by using options.     This is an advance option-based strategy, not recommended for those who are not experienced with options.

Synthetic long  =  Short Put + Long Call

Let me illustrate.   Find a pair of Put / Call options with the same strike, same expiration month for TBT.

For example, as of this writing – the  TBT Jan 2014, 76 Put price is $7.95 and 75 Call price is $7.425.    If I short Put and long Call, I will bring in $0.525 credit per share, or $52.5 per lot.    Yes, this trade won’t cost me any money.  In fact, I will get some extra cash into my account.    It will however, reduce my available margin.

TBT Option Chain

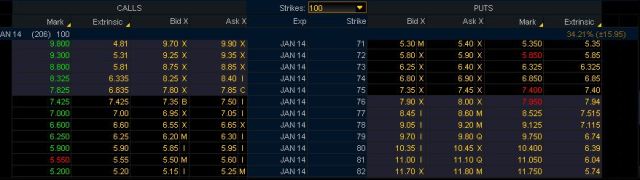
It’s important to note the extrinsic value of the two options.    As shown in the above screen shot from my ThinkorSwim platform,  the extrinsic values for the Put and Call are $7.94 and $7.425 respectively.  That means if I trade a short Put and long Call combo,  not only will I receive cash into my account, I’ll also get a $0.515 net positive extrinsic value or in other words,  I’ll start with a $0.515 profit advantage as compared to buying the TBT outright as an ETF.      If  TBT’s price remains unchanged when the options expire in Jan 2014,  I will gain $0.515 per share.

Yes, the underlying TBT doesn’t have to increase a cent  for the synthetic position to make a profit.   That’s the beauty of trading synthetic stocks using options.  Most of the time, the Put options come with higher implied volatilities than Call options.  Hence, you get this type of “Free” profits.    In this example, the gain isn’t much.   But in many other cases I have traded,  I can get an average of 3%-5% or even up to 20% of profit advantage relative to the stock price.

Once established,  this short Put / long Call combo can be held until expiration just like buying and holding the ETF itself.   Usually,  a week or so before expiration, I will roll the position over to avoid being assigned the actual ETF if the Put option goes in the money.   The choice of Put / Call pair depends on the net extrinsic value and usually I like to trade strike prices that offer my net positive cash.

Another great advantage of this trade is that it doesn’t take up any cash.   Yes, it will reduce margin or options buying power in your account,  but if you are already holding long-term stocks in your account like I do  (let’s say for dividend), you will have a lot of “free” options buying power to trade with.   In essence,  this trade requires no capital and hence any gain you can get out of it represents an infinite yield (anything divided by zero is infinite).   That’s why this is one of my favourite long-term options trade.

Posted in Options Strategies, Options Techniques | Tagged , , , , , , , | Leave a comment

Bad habit of jumping in and out of stock

Like many investors,  I have the tendency to jump in and out of stock,  in the attempt to catch the turning point.   As a value investor,  I am supposed to find great businesses, buy them at reasonable prices and hold them as long as their business fundamentals stay intact.    

In general,  I am able to be patient after finding a good business.   I am able to wait for the right entry price even if that wait is a long one.    What I find difficult is not to take profit prematurely.   The urge and sometimes fear of losing the profit is so strong,  I often find reasons to jump out of a stock,  just to find myself locked out of great businesses as the stock price takes off after I’m out.

Case in point –  YUM.    I was sitting on profit when Yum! ran into issues with the quality of chicken from their suppliers in China couple months ago.   The bad news flooded the wire.  I knew YUM brand is a fantastic business to own.  I have been following Yum and owned their shares for a long time.    But as the bad news hit,  my brain started to play tricks on me.   I started to focus on facts that fit the news.    Finally, I thought to myself,  let’s take profit here and maybe I can pick up Yum again at a lower price.    There are voices in my head that said things like … “No one has ever lost money by taking profits anyway”

Well…. yesterday Yum reported a -20% comp store sales in China from a month ago.   That’s negative but it was better than market expectation.    Yum ramped 7% during after hours.

Lesson learned –  no one is smart enough to time the market.   Timing is gambling and gambling is an entertainment that will always cost money.


Posted in Uncategorized | Leave a comment

Ignore the Experts and the News

Over the years of investing,  I have lost more money and opportunities by listening to experts than all other factors put together.   But after all these years, I still commit such mistake from time to time.

Stock analysts are supposed to be experts in their fields.   They are supposed to be independent, fact-based, analytical and unbias.  But, they are instead herd-followers and often produce reports where facts are curve-fitted to suit their biases.    Analysts on average are not only herd animals but they are among the slowest moving ones that are frequently eaten by the lions.

Another group of so-called experts are the talking heads on CNBC.   They split into two groups.   The first group is opportunity-based and the other is theme-based.   The opportunity-based experts hop on what’s hot at the moment.   When Apple was sizzling hot, they offer all kinds of reasons why AAPL should reach $1000 sooner than later.  When AAPL is out-of-favor like right now,  the very same talking heads are ridiculing people for not seeing iPhone is nothing but dead wood.

On the other hand, the theme-based talking heads are those who focus on a single message and the repeat it over and over and over again.  Because they know if they say it enough times,  eventually it will be true.   For example, there are many “the-world-is-ending” gurus.   They often appear on CNBC predicting stock market collapse year after year.   I’m sure everyone who watches CNBC has come across some of them.     They know their strategy works.   Just get on CNBC at the beginning of each year,  predict how badly the market will crash that year, and if they are wrong, no problem,  get on the next year,  give a silly excuse and give another market-crash prediction again.   They are wrong most of the time, but people forget.   All it takes is one eventual market pull back,  which has a 100% probability of happening given long enough time,  they will take all the credit for predicting a market collapse.   CNBC will call them the genius who predicted the last market melt down.   They can then sell lots of books and paid seminars.   People are suckers for such scams.  That’s why they are so popular.

My conclusion is it’s best not to watch CNBC and read analysts reports.   If you’re like me, I have developed a habit of having financial news on at the background while I work,  I just treat them as entertainment.   I do read analysts reports too but I only extract data out of the report,  do my own analysis and ignore the recommendations.

As Warren Buffer said,  the most important success factor of good investing is independent thinking.   I find that a golden principle that is easy to understand but takes a lifetime to master.


Posted in Uncategorized | Leave a comment

Synthetic Short Stock

Further on my previous blog post about the benefits of using options to create a synthetic long stock position,   the same technique can be used to short stock.     The benefits though are slightly different and arguably more.

Firstly,  a synthetic short stock position can be established by simultaneously holding a short Call and a long Put of the same strike, same expiration of a particular stock.    The benefits of holding a synthetic position instead of a short stock position are :

1.  No need to borrow stock.   As anyone who short stock frequently knows,  stocks are not always available to be borrowed when you need it.  That’s very frustrating.   You could have waited patiently for months before a stock finally reached the desired price level.   Then you hit the wall  –  there is no stock available anywhere to borrow from.   The synthetic position, on the other hand,  does not involve borrowing.   Therefore, you can enter the synthetic position any time you wish.

2.  No interest charged.    Since the synthetic position does not involve borrowing of stocks,  there is no admin fee and no interest charged, other than the normal commission for trading the options.

3.  Lower margin required.    Same as synthetic long position.   The synthetic short position requires lower margin than shorting the stock outright.  The actual difference in margin required will depend on the broker and the type of account you have.

4.  No Short squeeze.   Again,  as there is no borrowing of stocks, there is no chance of anyone demanding the return of the borrowed stocks.

5.  No dividend payout.  I guess this is the biggest benefit in my opinion.   If you short a dividend carrying stock,   you would have to pay the stock owner the dividend when it is due.   This is a risk.   But this is a non-issue for the synthetic position.

I don’t do much shorting but sometimes when I do,  I always prefer to go with synthetic.  It may sound complicated and risky but it really isn’t.   Once you have done it once,  you’ll know it’s really simple and straight forward,  minus the risk and hassle of shorting stock outright.

Posted in Options Fundamentals, Options Strategies, Options Techniques | Tagged , | Leave a comment

Retiring with Synthetic Long Stocks

There is a better way to hold stocks for the long term,   and that’s by buying a Call option and Selling a Put option at the same strike price and with the same expiry simultaneously.   This strategy is commonly called synthetic long stock.   A simple description of the strategy is listed here 

Why is it better ?    To me two main reasons :

(1) it requires less capital to achieve EXACTLY the same result as buying and holding a stock outright.     Typically,  a synthetic position only requires less than 50% of the capital required for holding stocks, depending on how far away is the expiration date and what are the strike prices.

(2) at times,  when the Put premium is higher than the Call premium,  the break even point of the synthetic position might be even lower than the stock.   Meaning if the stock is trading at $100.  Break even point for the stock is obviously $100.    But the synthetic position might have a break-even point of $95.   It’s possible.   I’ll give an example below.

What about risks?    No more, no less risk.    Some people freak out when they hear “selling Put option naked”.   People have read about the risk of selling Put option naked.   It’s true.  Selling Put option naked has unlimited downside risk but so does buying stock and holding it long term.

What I’m assuming is the same value investing discipline is practiced.   If that is the case,  then the synthetic long stock position has ZERO additional risk compared to holding stock.  The P&L of the two positions will be identical at expiration.   The key word to stress here is “at expiration”.  Meaning if you choose a 6 months option,  you must be prepared to hold it till expiration because along the way, the implied volatility of the Put / Call options might change and there is no telling how the interim P&L will behave.

Example :   Let me use WPRT, Westport Innovations as an example.    I chose this stock purely because it has a hugely imbalanced Put / Call premium which I can use to illustrate the concept of a lower break even point.   I am not suggesting at all that this is a value stock I would invest in.

At the closing on Feb 22, 2013,  WPRT Stock Price = $30.    January 2015,  $30 Put has a mid price of $10.10.   January 2015, $30 Call has a mid price of $5.10.

To construct a synthetic long position,  buy 1 lot x 30 Call and Short 1 lot x 30 Put.   So, pay $5.10 and receive $10.10.  Net premium = + $5.00.    However to do this position,  option brokers will require margin for the naked short Put.   Margin simply means the amount you have to set aside in your account, which your broker will not allow you to trade with.

I keyed the position into my broker’s option analyzer platform and I got $1,407.    That means a synthetic long position equivalent to 100 stocks of WPRT will cost me $1,407 , whereas if I buy the stock outright, I would have to pay $3,000.    That means only 47% of my capital is used for a position that gives me the same risk/reward as the long stock.

In addition,   this position gives me a significantly lower break-even point.     At expiration, if WPRT stays unchanged at $30.   I will pocket the $5.00 premium (see above).   Isn’t it great to be able to profit even when the stock hasn’t moved at all ?    Yes this is absolutely true.  No gimmicks here.

In fact,  the $5.00 premium is mine to keep regardless what the stock price does.   However,  if the stock price moves down,  I will incur losses of the same amount as I would holding the long stock.  However, I have the $5 premium to offset with.   Therefore my true break even point is $30 – $5 = $25.   If the stock stays above $25, I gain.   Below $25, I lose.  That is way better than buying the stock outright at $30 now,  isn’t it?

I believe synthetic options can help stretch a value investor’s capital,   an important advantage for retirees.     But … one must thoroughly understand what he’s doing before jumping in with both feet.    The beauty is there are many free broker platforms you can do paper trades with.     Do lots of practice.   It’s free and no risk.    Convince yourself that synthetic options give you exactly the same results as holding stock outright.   Convince yourself that you can profit with paper trades,  then start to gradually migrate your long stock positions into synthetics.

Maybe this technique can help you retire earlier with the same amount of planned capital.

Posted in Options Strategies, Options Techniques, Value Investing | Tagged , , | Leave a comment

Buy and Hold Does Not Equal Value Investing

I watch a famous CNBC commentator confidently declared that value investing is dead.   He said, “Just look at S&P500, if you had purchased the index at its high back in 2000,  you would still be linking your wounds.”

I think this person is mistaken in two ways….

(1) buy and hold doesn’t equal value investing.  The CNBC person mistakenly equate the two.    Although value investors normally do hold their purchase for a long time,  by holding stocks long-term doesn’t mean value investing,  and

(2) Value investing doesn’t mean buying stocks randomly, like an index, and holding it indiscriminately    Value investing involves careful selection of which businesses to buy and buying only when they are selling at great discounts to intrinsic value.

Not only is value investing not dead in this new era,  there are actually more opportunities for value investors  now than before.    Thanks to high frequency trading and the short term orientation in the market,    price movements are more exaggerated in both directions now than before.   This creates bigger value gaps  on both the downside and the upside for us to take advantage of.

In addition,  the boom to bust cycles seem to be shorter as well.   Stocks can rotate in and out of favor in the market in the matter of months if not weeks,  whereas we used to have to wait for years for out of favored stocks to be back in favor again.

Take AAPL for instance,  the stock goes into hot and cold cycles almost every 6 months.  At this point in time,  AAPL is like poison,  no one seems to want to get near it even with a ten foot pole.    It was only in September 2012, less than six months ago, that AAPL reached its all time high.    And before that,  AAPL went through another hot cycle just 6 months ago, reaching its last peak in March 2012.     I won’t be surprised if AAPL will be back in favor again soon.

Today’s AAPL is sold for the same price as it did more than a year ago.   Despite all the doom and gloom prediction on AAPL’s future,  if we just focus on their actual performance,  AAPL definitely is more valuable today than it was a year ago.   It generates more earnings and high cash flow now than a year ago.  It sold more iPhones and iPads now than a year ago.   So, what’s different ?    Market sentiment.

Value investing isn’t dead.  In fact, it remains very alive.   Nothing has changed.   The reason is very simple –  market behavior is the result of human behavior and human behavior hasn’t change over the past thousands of years.   Why should market?   If value investing worked when Benjamin Graham and Warren Buffett practiced it 50 years ago,  why shouldn’t it continue to work now and for the foreseeable future?

Posted in Uncategorized | 1 Comment